THE GARDEN
Updated 01 Oct 2026
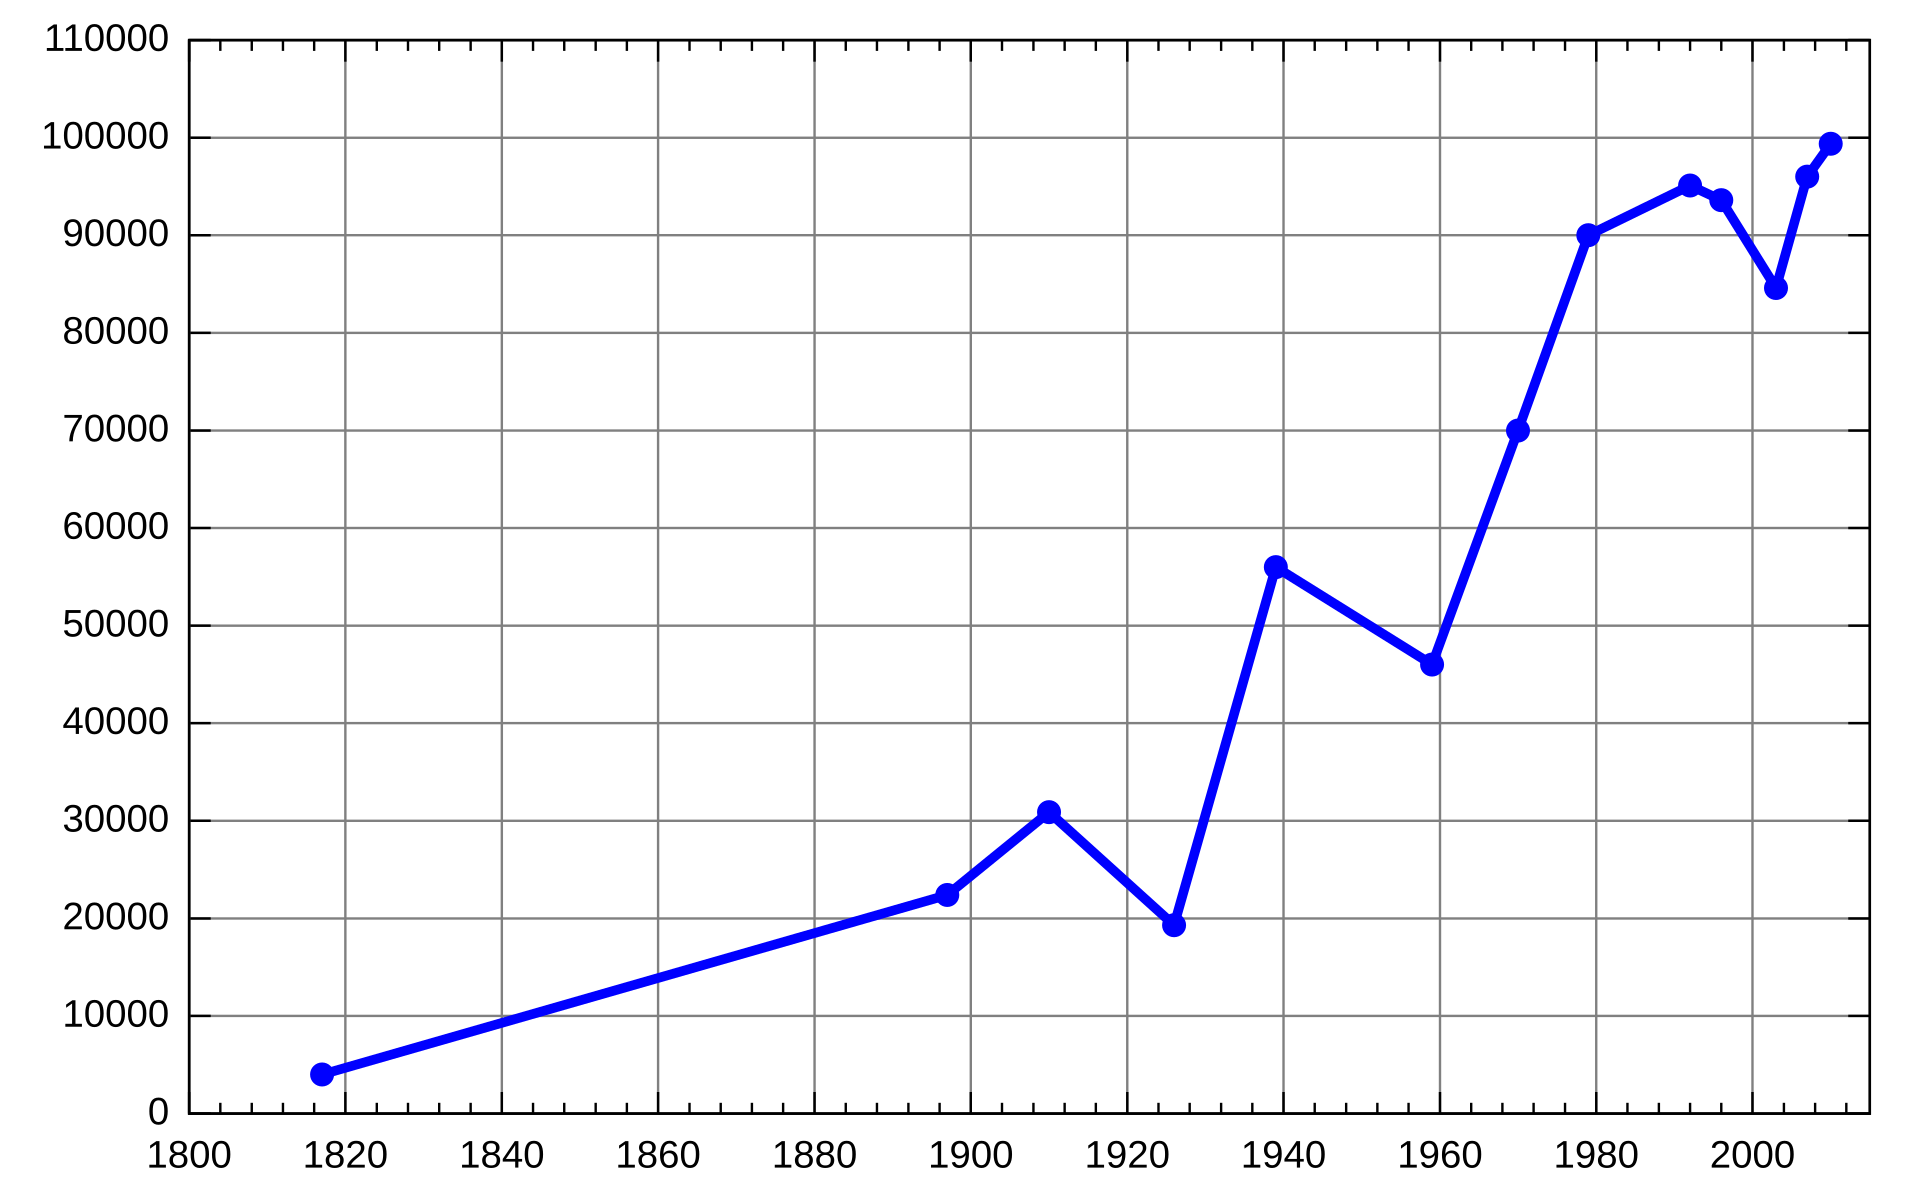
connects observations along an ordered horizontal variable, commonly time, to show change
connecting points implies a meaningful sequence; arbitrary category order usually calls for a Bar Chart
unequal time intervals should have appropriately spaced positions
check whether the vertical axis is truncated before interpreting the apparent steepness of change
◌ Explore connections in Graph view
Paths through the garden