THE GARDEN
Updated 01 Oct 2026
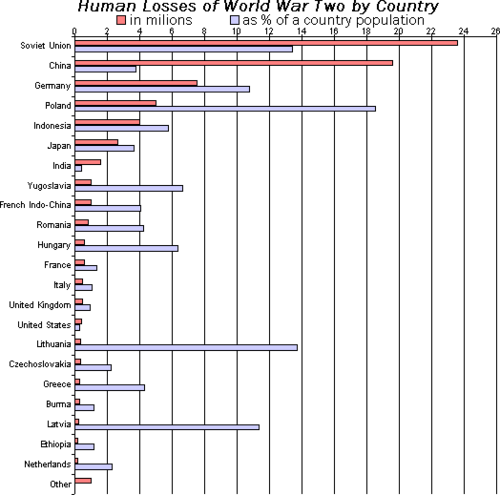
displays a numerical value for each category using bar length
simple: one value per cateogry
grouped: compare several series within each category
stacked: show a total divided into components; a 100% stacked chart emphasizes proportions
bar lengths normally need a zero baseline for meaningful magnitude cmoparisons.
comparing interior segments of stacked bars is harder because they lack a shared baseline
Frequency Histogram groups numerical observations into intervals; a bar chart compares categories
◌ Explore connections in Graph view
Paths through the garden