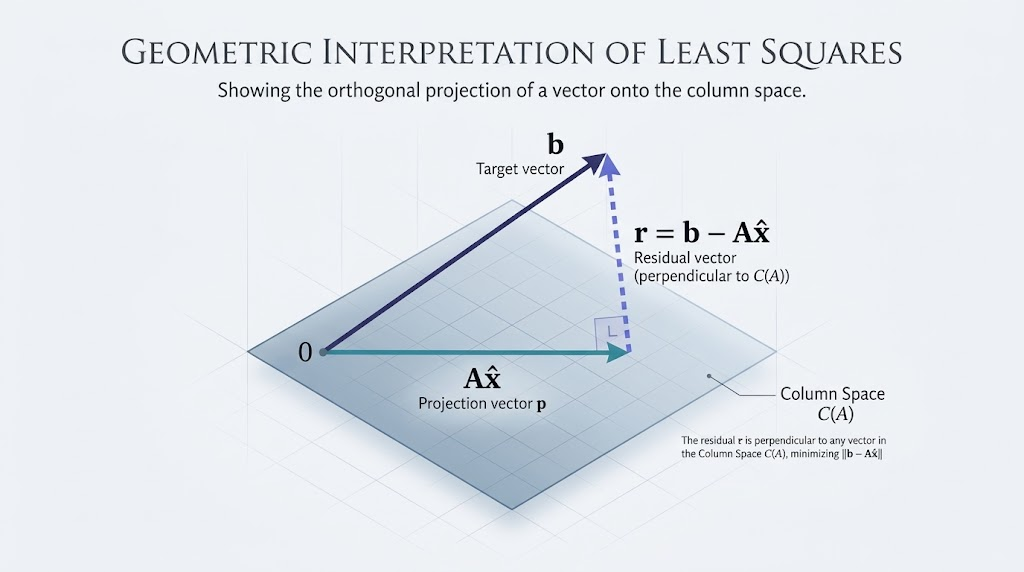
Least squares
- •
- •
Numerical pratice
- •
Uses and worked line fit
- •
Model construction
- •
- •
- •
- •
- •
Multicollinearity
- •
near-dependent predictor columns make individual coefficient estimates sensitive.
- •
Variance inflation factor -> .
- •
here comes from regressing predictor on the other predictors, with an intercept.
- •
with only two predictors, is their squared correlation.
- •
cutoffs such as VIF 10 are heuristics, not guarantees of model quality.
- •
- •
Linearizing nonlinear models
- •
- •
- •
- •
The loss changes
- •
least squares after transformation minimizes transformed residuals, not original-scale SSE.
- •
for small additive errors, log-space fitting approximately weights original squared residuals by .
- •
reciprocal-space fitting approximately weights them by .
- •
choose according to the error model; transformed fitting is not inherently wrong or always inferior.
- •
a transformed fit can provide initial values for original-scale nonlinear least squares with
scipy.optimize.curve_fit.
- •
- •
- •
Fit quality and residual diagnostics
- •
define ; , .
- •
let be the number of fitted coefficients, including an intercept; require for residual degrees of freedom
- •
Metrics
- •
RMSE -> ; error scale in response units
- •
MAE -> ; less dominated by large errors than squared loss
- •
Residual standard deviation -> ; not the same denominator as RMSE.
- •
Determination -> , for .
- •
Adjusted determination -> .
- •
can be negative, especially on held-out data; the formula is undefined for constant targets.
- •
adding regressors need not imrpove adjusted ; neither metric alone proves generalization
- •
- •
Residual plots
- •
curvature -> possible missing model structure
- •
funnel-shaped spread -> possible nonconstant variance; consider an appropriate model or weighted least squares
- •
patterns over time/order -> possible dependence; appearance alone does not prove independence
- •
squared loss is outlier-sensitive; investigate unusual data and consider justified robust losses such as absolute or Huber loss
- •
- •
Additional diagnostics
- •
compare models using held-out evidence as well as in-sample diagnostics; see evaluation splits and leakage
- •
- •
Worked comparisons
- •
Python: array-based curve fitting
- •
standalone block using NumPy and SciPy; original-scale residuals are compared on the same observations.
- •
lstsqavoids an explicit normal-equation inverse; polynomial columns are ordered constant, linear, quadratic. - •
curve_fitcovariance is an approximate uncertainty estimate under assumptions, not automatic confidence intervals. - •
import numpy as np
from scipy.optimize import curve_fit

x = np.array([0., 1., 2., 3., 4.])
y = np.array([1., 1.8, 1.3, 2.5, 6.3])
X = np.column_stack((np.ones_like(x), x, x*x))
coefficients, _, rank, _ = np.linalg.lstsq(X, y, rcond=None)
assert rank == X.shape[1]
assert np.allclose(coefficients, [1.42, -1.07, 0.55])

substrate = np.array([1., 2., 5., 10.])
rate = np.array([2.5, 4., 6.3, 7.7])
Z = np.column_stack((np.ones_like(substrate), 1/substrate))
a0, a1 = np.linalg.lstsq(Z, 1/rate, rcond=None)[0]
initial = np.array([1/a0, a1/a0])
def saturation(s, vmax, km):
      return vmax*s/(km+s)
fitted, covariance = curve_fit(saturation, substrate, rate, p0=initial, bounds=(0, np.inf))
def rmse(parameters):
      return np.sqrt(np.mean((rate - saturation(substrate, *parameters))**2))
assert rmse(fitted) <= rmse(initial)
assert np.allclose(initial, [10.06879170, 3.028094885], rtol=1e-7)
print("quadratic coefficients:", coefficients)
print("reciprocal fit:", initial, "original-scale RMSE:", rmse(initial))
print("nonlinear fit:", fitted, "original-scale RMSE:", rmse(fitted))
- •
- •
Python: centered least squares
- •
- •
import math

def fit_line(xs, ys, spread_tol=1e-12):
      xs, ys = list(xs), list(ys)
      if len(xs) != len(ys) or len(xs) < 2:
          raise ValueError("need equal lengths and at least two observations")
      if not math.isfinite(spread_tol) or spread_tol <= 0:
          raise ValueError("positive finite spread tolerance required")
      if not all(math.isfinite(v) for v in xs+ys):
          raise ValueError("nonfinite data")
      n = len(xs)
      mx, my = math.fsum(v/n for v in xs), math.fsum(v/n for v in ys)
      dx = [v-mx for v in xs]
      scale = max(1.0, max(abs(v) for v in xs))
      spread = max(abs(v) for v in dx)
      if not math.isfinite(spread) or spread/scale <= spread_tol:
          raise ValueError("predictors constant or numerically unresolved")
      ux = [v/spread for v in dx]
      scaled_slope = math.fsum(u*(y-my) for u, y in zip(ux, ys))/math.fsum(u*u for u in ux)
      slope = scaled_slope/spread
      intercept = my-slope*mx
      residuals = [y-(intercept+slope*x) for x, y in zip(xs, ys)]
      sse = math.fsum(r*r for r in residuals)
      if not all(math.isfinite(v) for v in (slope, intercept, sse)):
          raise ValueError("fit overflow or nonfinite result")
      return intercept, slope, sse, math.sqrt(sse/n)

intercept, slope, sse, rmse = fit_line([1,2,3,4,5], [2,3,5,6,8])
assert math.isclose(intercept, 0.3, abs_tol=1e-14)
assert math.isclose(slope, 1.5, abs_tol=1e-14)
assert math.isclose(sse, 0.3, abs_tol=1e-14)
assert math.isclose(intercept+6*slope, 9.3, abs_tol=1e-14)
for xs, ys in [([1,1], [2,3]), ([1,2], [3]), ([1,math.nan], [2,3])]:
      try:
          fit_line(xs, ys)
      except ValueError:
          pass
      else:
          raise AssertionError("invalid fit accepted")
print(f"least squares: intercept={intercept:.12f}, slope={slope:.12f}, "
        f"prediction(6)={intercept+6*slope:.12f}, SSE={sse:.12f}, RMSE={rmse:.12f}")
- •
Excel VBA: centered least squares
- •
- •
- •
Private Function FitCell(ByVal cell As Range) As Double
      Dim value As Variant
      value = cell.Value2
      If IsError(value) Then Err.Raise vbObjectError + 401, "FitLine", "Error cell"
      If IsEmpty(value) Then Err.Raise vbObjectError + 402, "FitLine", "Empty cell"
      If VarType(value) = vbBoolean Or VarType(value) = vbString Then _
          Err.Raise vbObjectError + 403, "FitLine", "Numeric cells required"
      If Not IsNumeric(value) Then Err.Raise vbObjectError + 404, "FitLine", "Nonnumeric cell"
      FitCell = CDbl(value)
  End Function

  Public Function FitLine(ByVal xs As Range, ByVal ys As Range, _
      Optional ByVal spreadTol As Double = 0.000000000001) As Variant
      Dim n As Long, i As Long, mx As Double, my As Double
      Dim spread As Double, scale As Double, dx As Double, ux As Double
      Dim sxx As Double, sxy As Double, slope As Double, intercept As Double
      Dim residual As Double, sse As Double, x() As Double, y() As Double
      If xs.Areas.Count <> 1 Or ys.Areas.Count <> 1 Or xs.Columns.Count <> 1 Or ys.Columns.Count <> 1 Then _
          Err.Raise vbObjectError + 405, "FitLine", "Single contiguous columns required"
      n = xs.Rows.Count
      If n < 2 Or n <> ys.Rows.Count Or spreadTol <= 0# Then _
          Err.Raise vbObjectError + 406, "FitLine", "Invalid dimensions or spread tolerance"
      ReDim x(1 To n): ReDim y(1 To n): scale = 1#
      For i = 1 To n
          x(i) = FitCell(xs.Cells(i, 1)): y(i) = FitCell(ys.Cells(i, 1))
          mx = mx + x(i) / n: my = my + y(i) / n
          If Abs(x(i)) > scale Then scale = Abs(x(i))
      Next i
      For i = 1 To n
          dx = Abs(x(i) - mx): If dx > spread Then spread = dx
      Next i
      If spread / scale <= spreadTol Then _
          Err.Raise vbObjectError + 407, "FitLine", "Predictors constant or unresolved"
      For i = 1 To n
          ux = (x(i) - mx) / spread
          sxx = sxx + ux * ux: sxy = sxy + ux * (y(i) - my)
      Next i
      slope = (sxy / sxx) / spread: intercept = my - slope * mx
      For i = 1 To n
          residual = y(i) - (intercept + slope * x(i))
          sse = sse + residual * residual
      Next i
      FitLine = Array(intercept, slope, sse, Sqr(sse / n))
  End Function

  Public Sub DemoLeastSquares()
      Dim result As Variant, ws As Worksheet
      On Error GoTo Failed
      Set ws = ActiveSheet
      result = FitLine(ws.Range("A2:A6"), ws.Range("B2:B6"))
      Debug.Print "intercept", result(0), "slope", result(1)
      Debug.Print "SSE", result(2), "RMSE", result(3)
      Debug.Print "prediction x=6", result(0) + 6# * result(1)
      Exit Sub
  Failed:
      Debug.Print "FAILED: " & Err.Description
  End Sub